
cosmos_monitoring

Monitoring validator node with Grafana and Telegraf
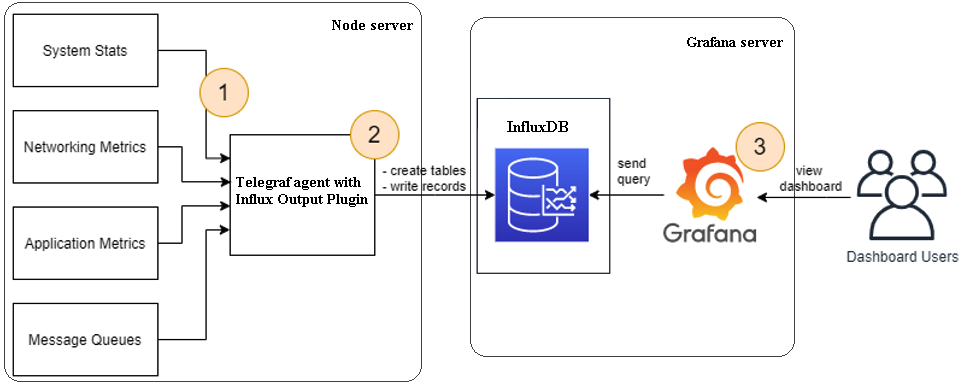
In this guide, we’re going to look at how to Monitor an validator node with Grafana and Telegraf.
Telegraf is an agent written in Go for collecting performance metrics from the system it’s running on and the services running on that system. The collected metrics are output to InfluxDB or other supported data stores. From InfluxDB, you should be able to visualize trends and systems performance using tools like Grafana.
Grafana is an open source, feature rich metrics dashboard and graph editor for Graphite, Elasticsearch, OpenTSDB, Prometheus, and InfluxDB.
1. Install Telegraf, InfluxDB, Grafana
For installation you can use this guide
2. Configure Grafana
Access Grafana Dashboard
Access Grafana Dashboard using the server IP address or hostname and port 3000.
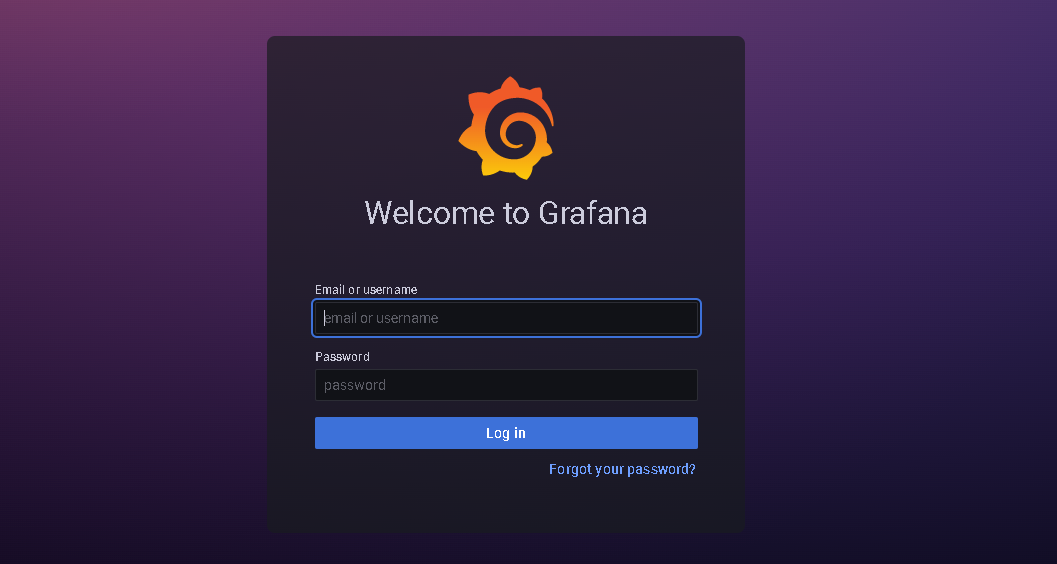
Default logins are:
Usermane:
adminPassword:
admin
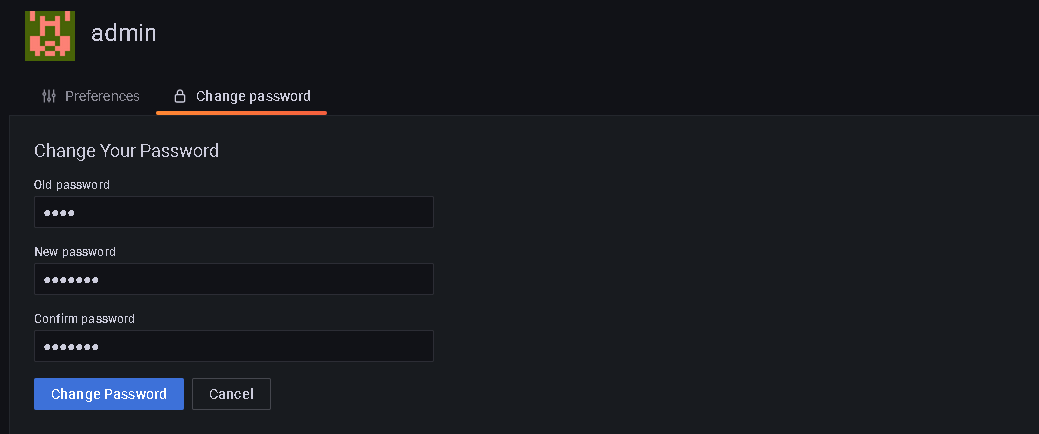
Change Admin Password
Remember to change admin password from default admin. Login and navigate to Preferences > Change Password:
Add an InfluxDB data source
Before add a dashboard to Grafana for Telegraf system metrics, you need to first import the data source.
Login to Grafana and go to Configuration > Data Sources > Add data source > InfluxDB.
Provide the following details:
Name – Any valid name
HTTP URL: InfluxDB URL address e.g http://localhost:8086 for local db server (
<grafana_ip>)
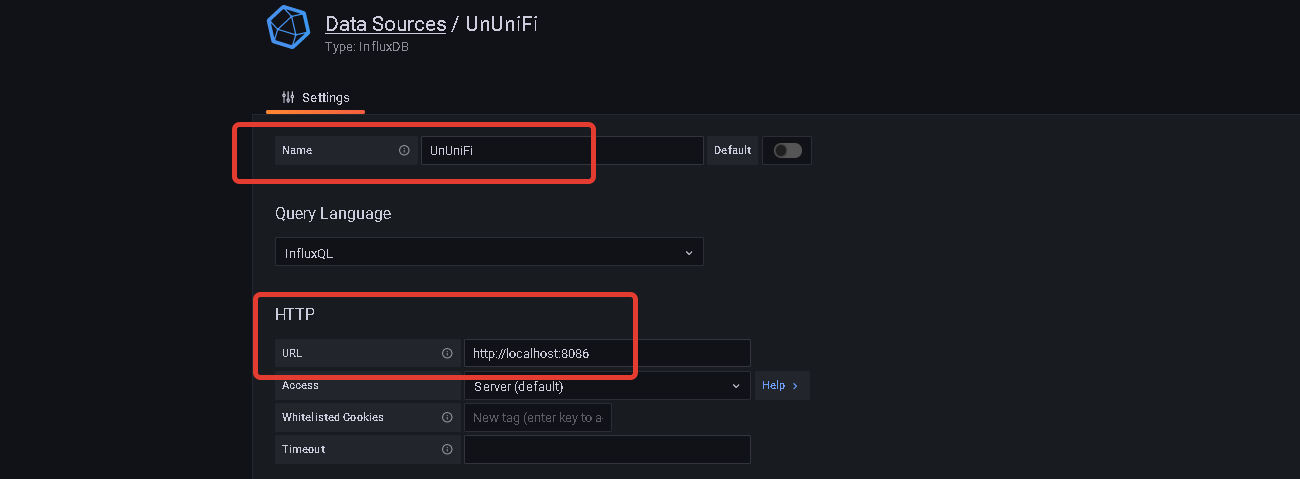
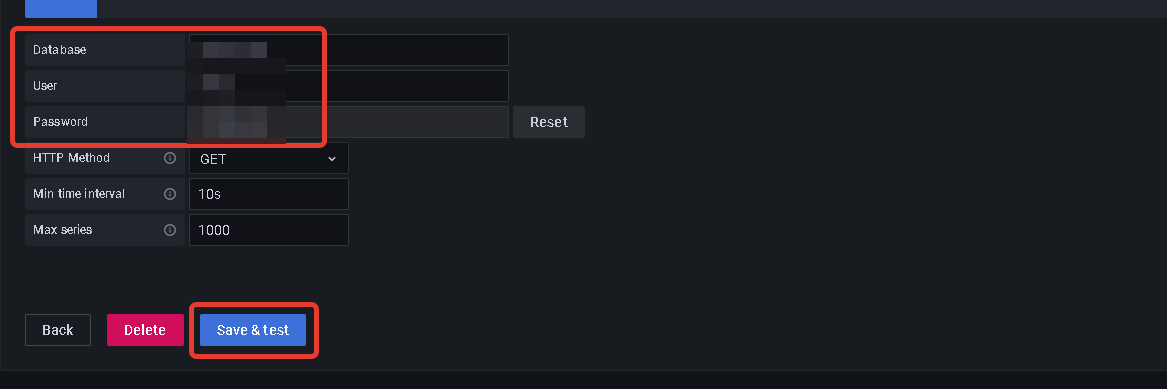
Under InfluxDB Details, provide:
Database name as defined on telegraf configuration file (
<database_name>)HTTP authentication username and password as configured on telegraf (
<database_login>,<database_password>)
Importing Grafana Dashboard
Once the data source has been added, the next thing is to import the dashboard. I customized one of the dashboards initially created by a user on the community and uploaded it.
Download the dashboard from here, it is in JSON format. The head over to Create > Import:
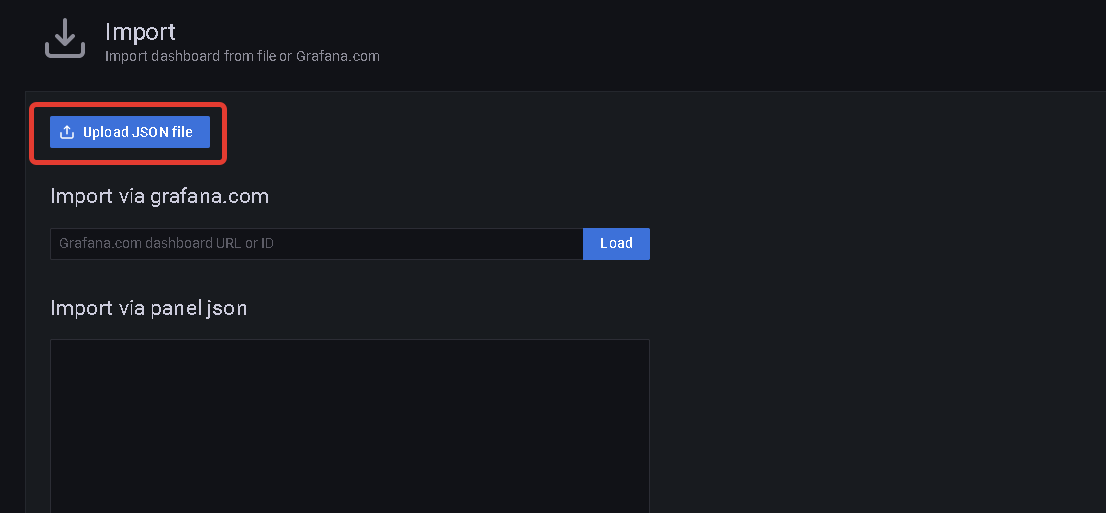
Under Options section, give it a unique name and select data source added earlier from the drop-down menu and click the import button.
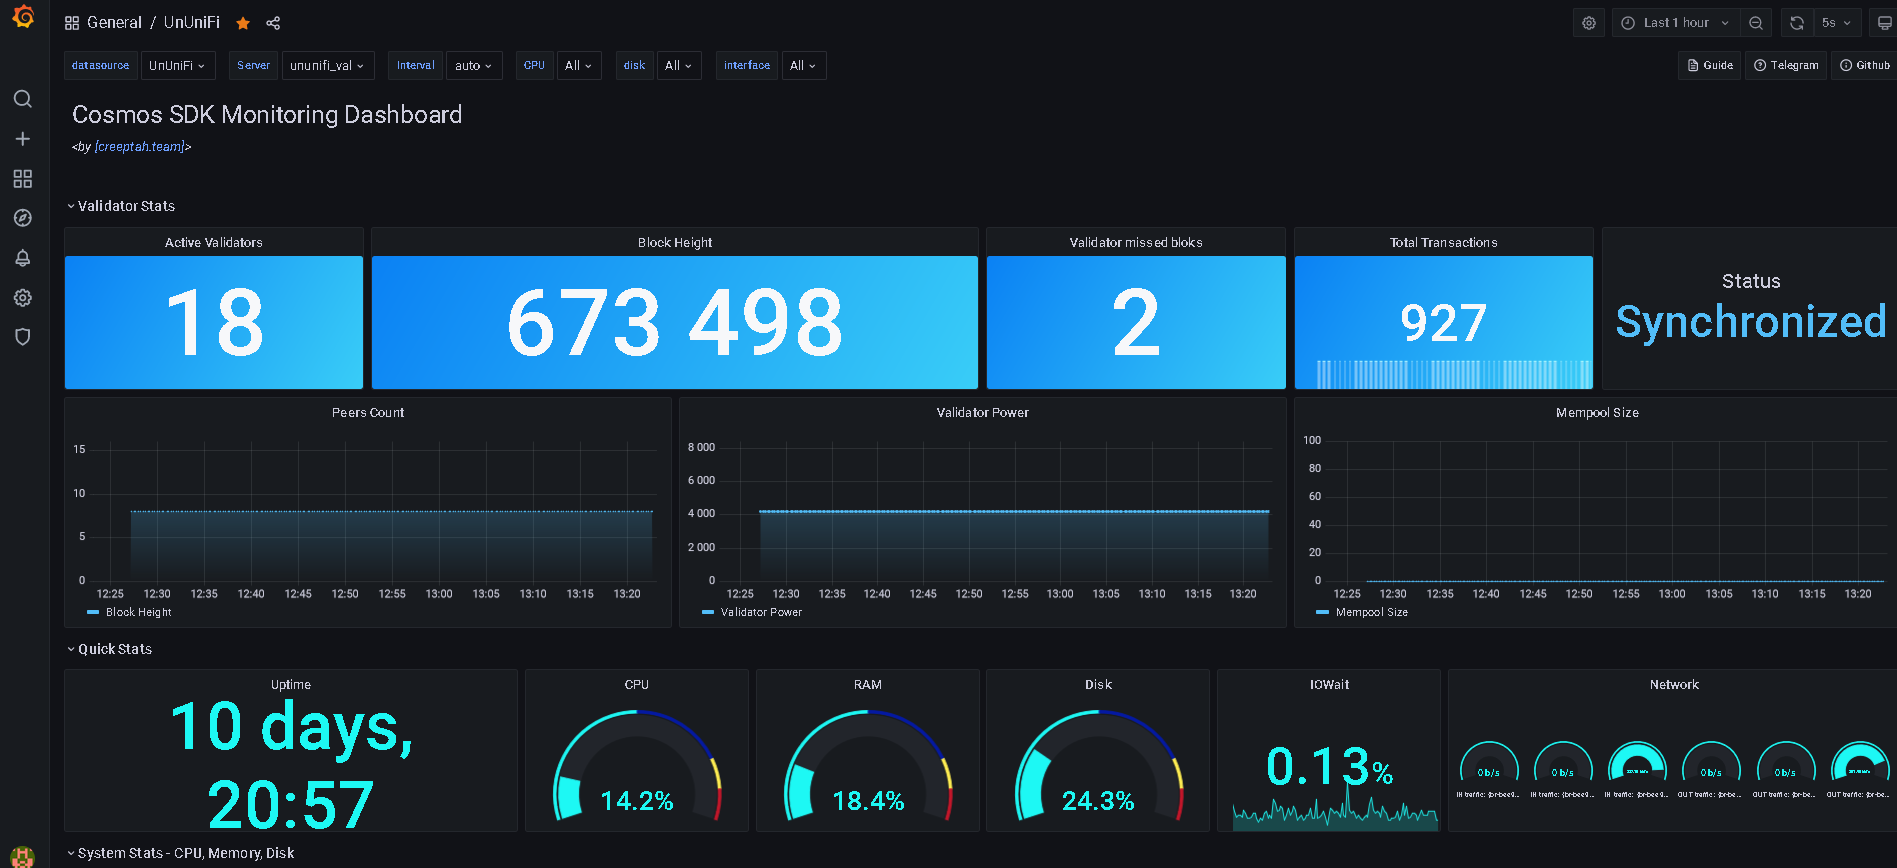
Set/check your datasource and Server:
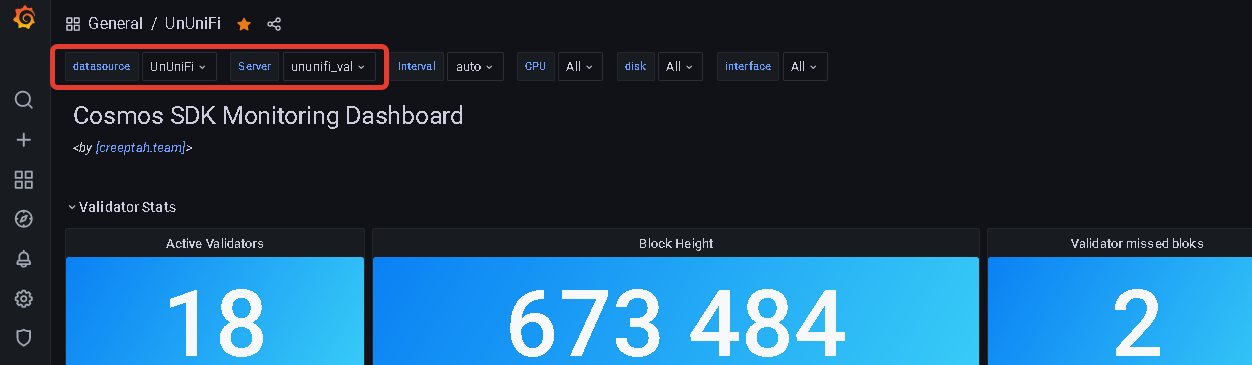
You should see Metrics being visualized immediately.
Link of Grafana Dashboard is here for example. Open dashboard in Search panel.
Last updated